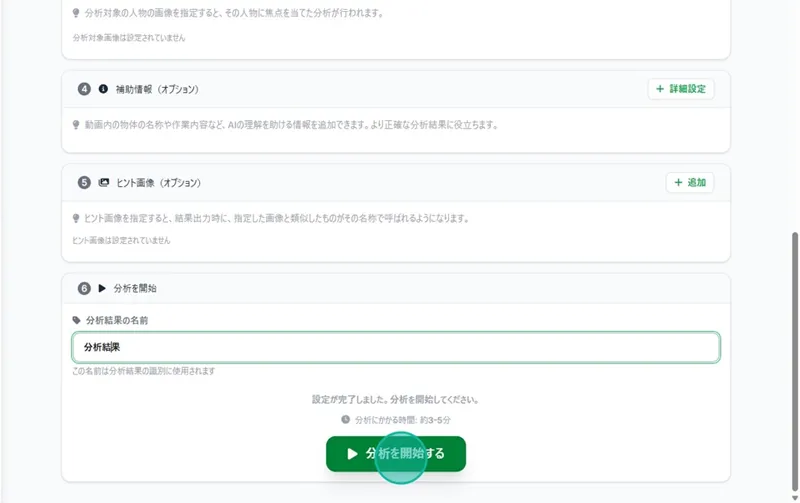
Scroll to the bottom of the page and click the "Start Analysis" button.
Viewing Analysis Results
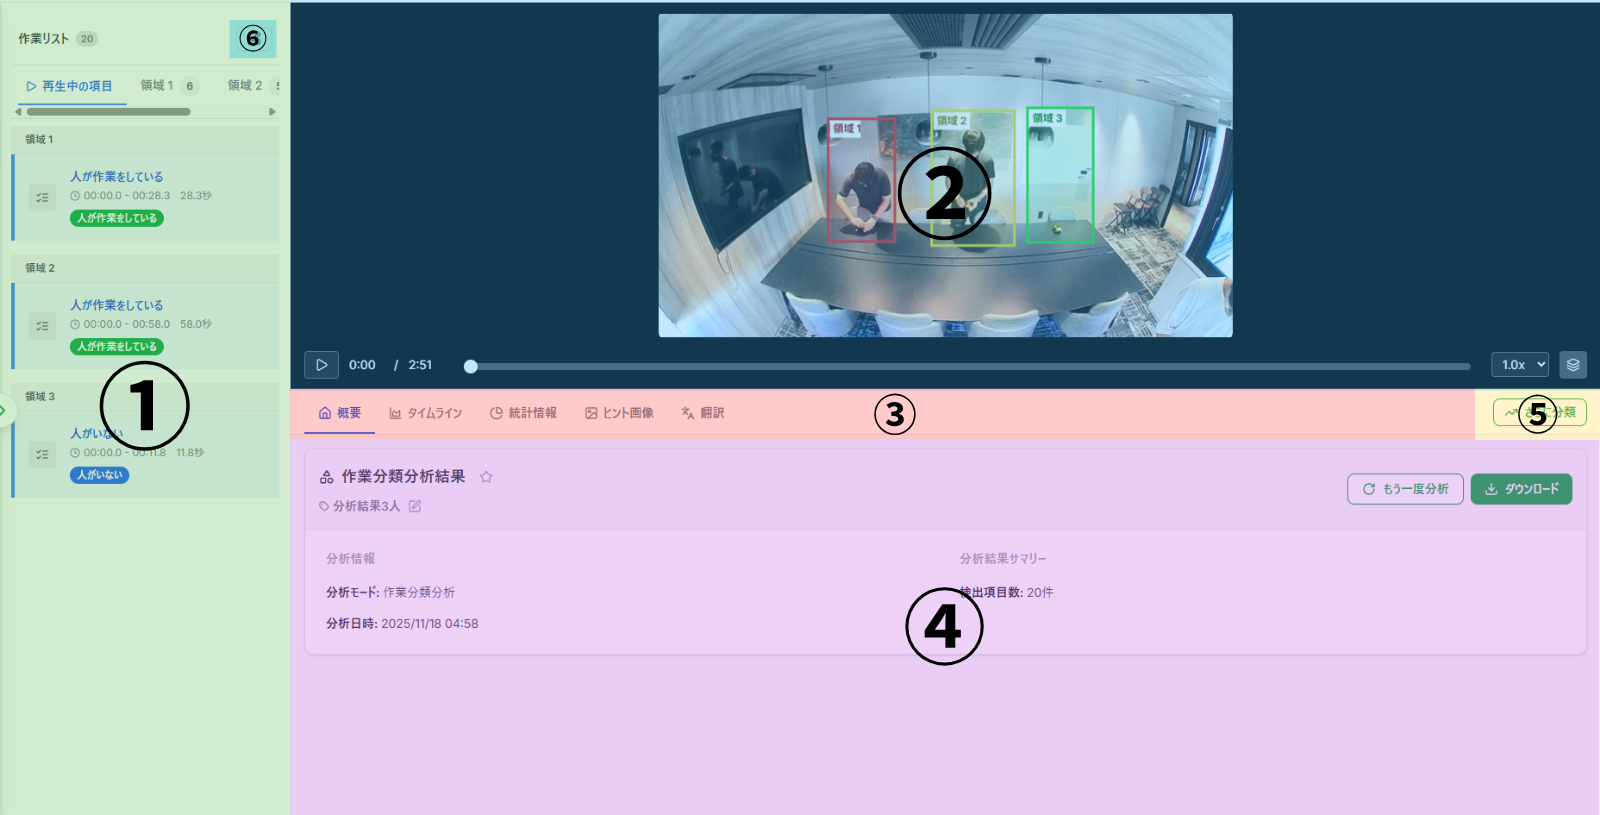
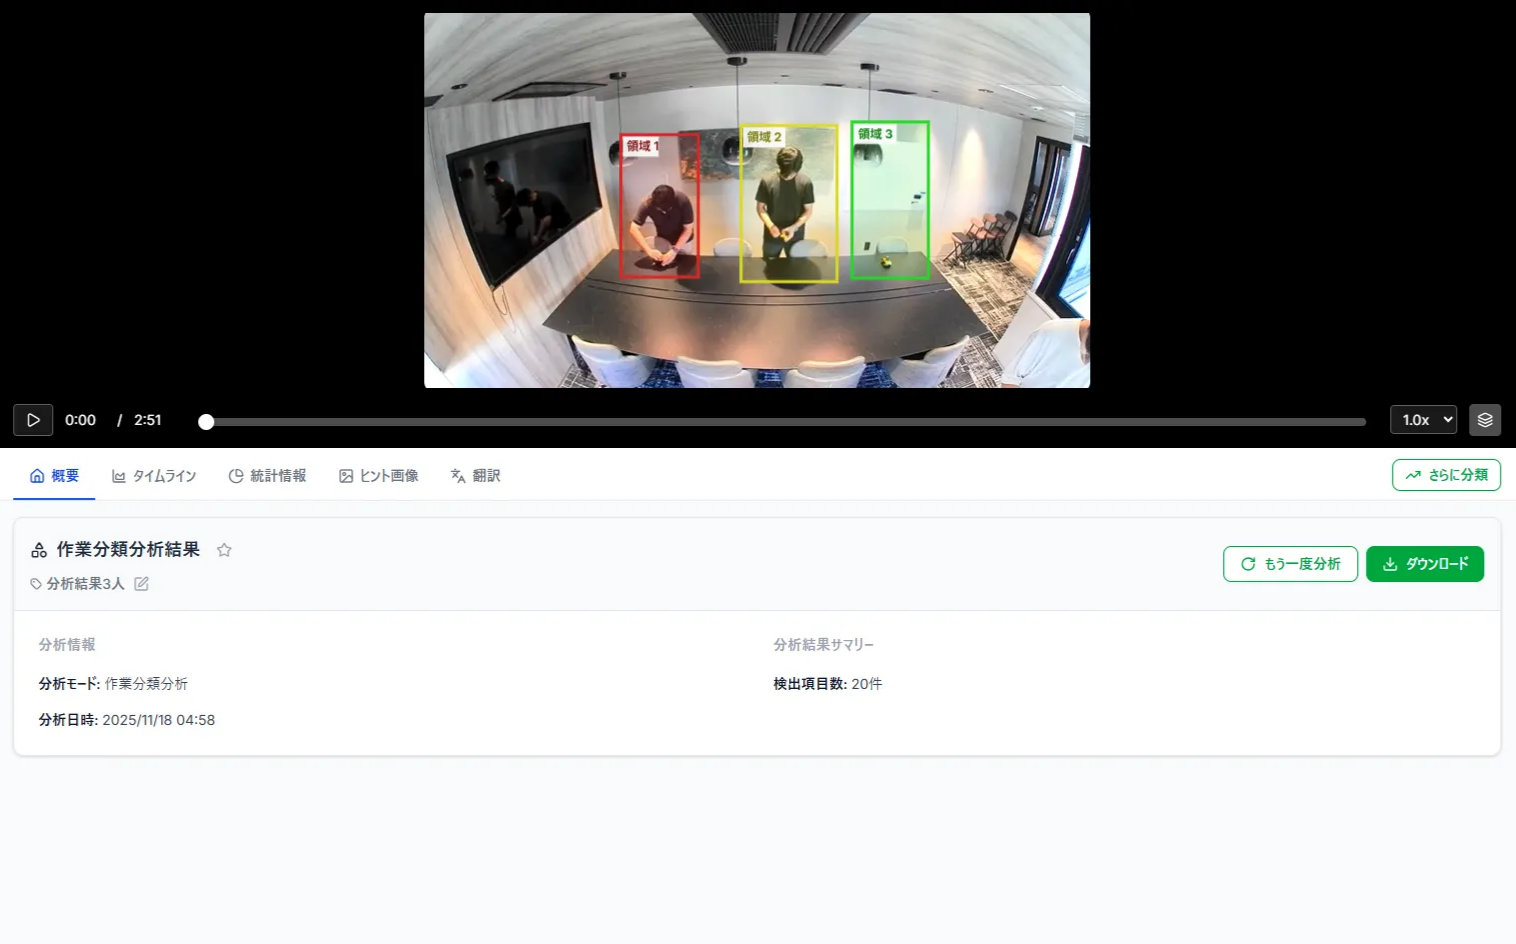
- Work List: Displays the item currently playing or the chronological classification for each area.
- Analysis Video Playback: Review the video and specified areas used for the analysis.
- Display Tabs: Select these to switch the type of information displayed.
- Analysis Result Display: Displays the analysis results based on the items selected in the "Display" tab.
- Analyze Further: Allows you to re-analyze and further refine classifications by specifying the area, analysis results, and additional categories.
- Edit Icon: Allows you to manually edit classification results.
💡 For details on 5 and 6, please refer to:Adjusting & Refining Results
Procedure List
👉 Displays the classified results along with timestamps (seconds) and duration within the video.
Loop Playback
- Clicking a process will loop the playback for that specific step.
- A rotating circular arrow icon next to the process indicates that loop playback is active.
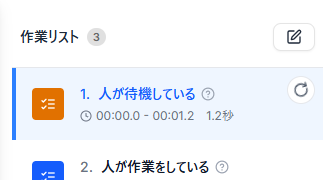
When a Single Area is specified or No Area is specified
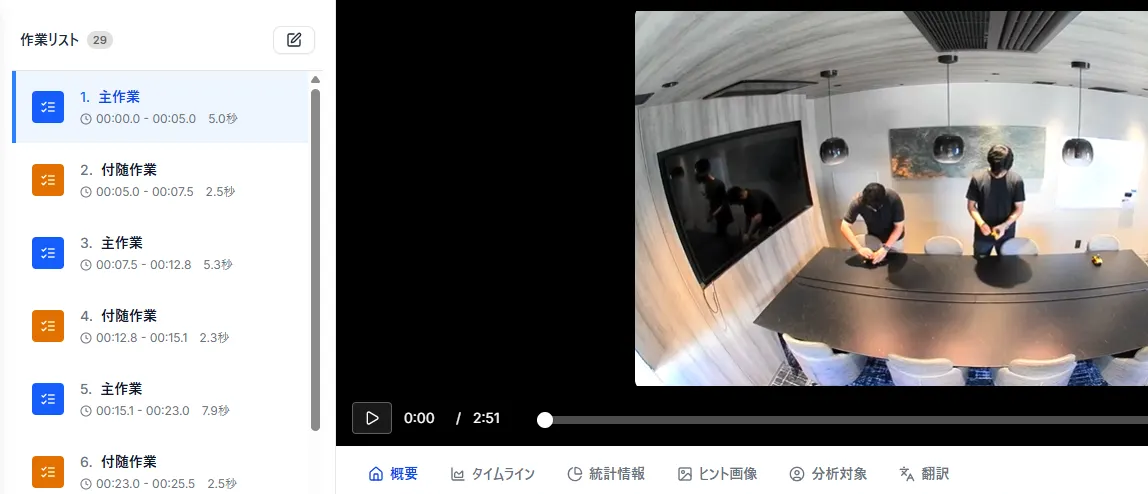
Displays classification results for the entire video (or the specified area).
- (Number next to list/area name): Displays the total number of analysis results.
- ? (Question Mark): Provides a verbalized explanation of the reasoning behind the analysis.
When Multiple Areas are Specified
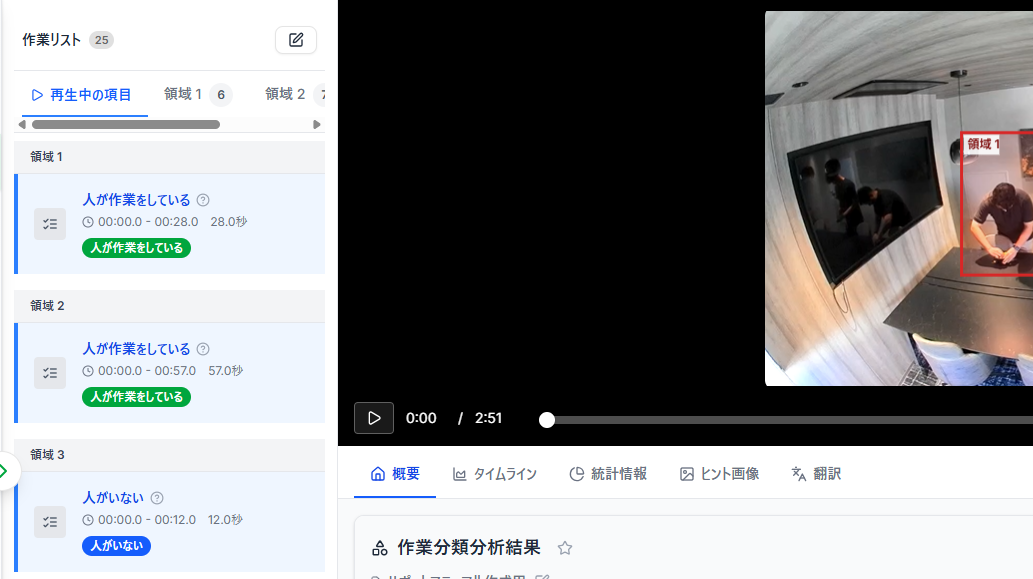
- Currently Playing Item: Shows what is occurring in the specified areas within the video currently playing.
- Area 1... (Specified Area Name): Displays classification results filtered specifically for that area.
- (Number next to list/area name): Displays the total number of analysis results.
- ? (Question Mark): Provides a verbalized explanation of the reasoning behind the analysis.
When using "Analyze Further" for Sub-Categories:
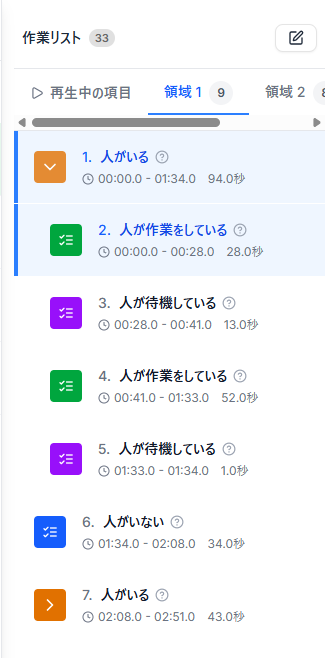
- Sub-Categories are grouped under a ">" icon.
- Click the icon to expand and view the sub-categories.
Analysis Video Playback
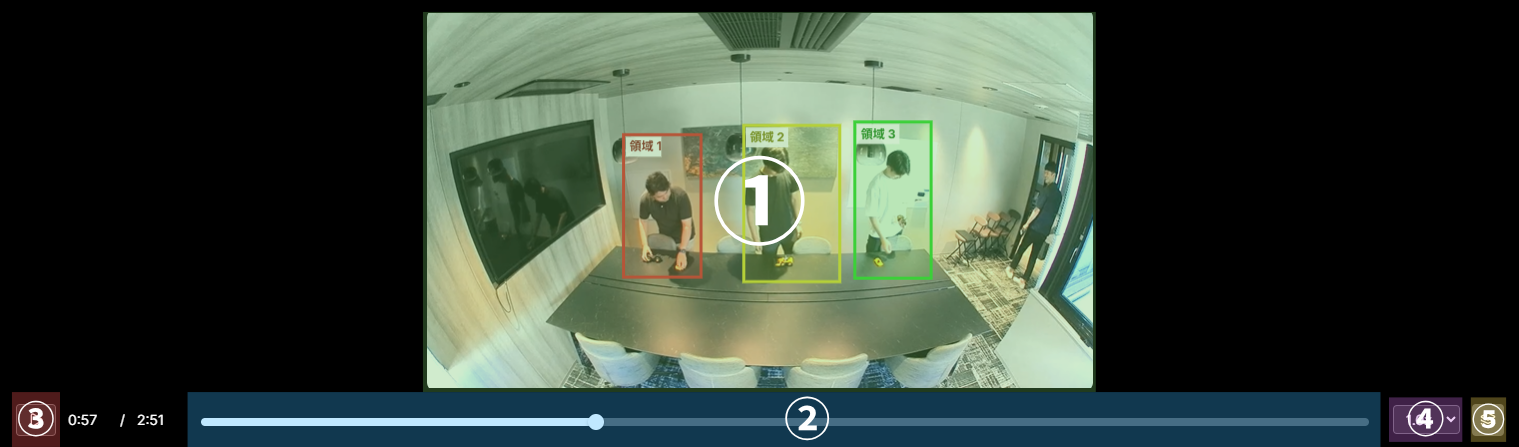
- Analysis Video: The video used for analysis is displayed in sync with the playback bar.
- Playback Bar: Allows you to play or pause the video at any point.
- Play Button: Play/Pause the video.
- Playback Speed Button: Select video speed from 0.5x to 8x.
- Area Display Button: Toggle the visibility of specified areas on or off.
Display Tabs & Analysis Results
Overview
👉 Displays an overview of the analysis.
Add to Favorites
👉 Adding to favorites makes it easier to find videos from the video list.
Download
👉 Download your analysis results.
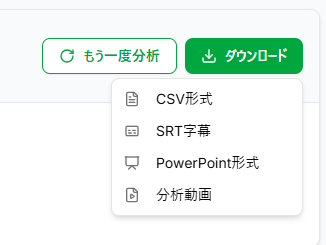
CSV Format
- Outputs a file named "(Analysis Name).csv" containing Area Name, Problem Description, Improvement Plan, Problem Type, Priority, Estimated Effect, and Start/End times.
SRT Format
Outputs a subtitle file in SRT format.
What is an SRT file?
💡 An SRT file is a text file for recording video subtitles.
SRT file example:> `00:00:00,000 --> 00:00:25,000[Area 1] [Problem] The workbench height is too low for the operator, causing a constant deep forward lean (slouched posture). This leads to fatigue accumulation and risks of back pain. Improvement: Adjust the workbench height or introduce a height-adjustable desk to allow for a comfortable, ergonomic posture.`
You can easily insert subtitles into videos using video editing software. Use this along with the analysis video download.
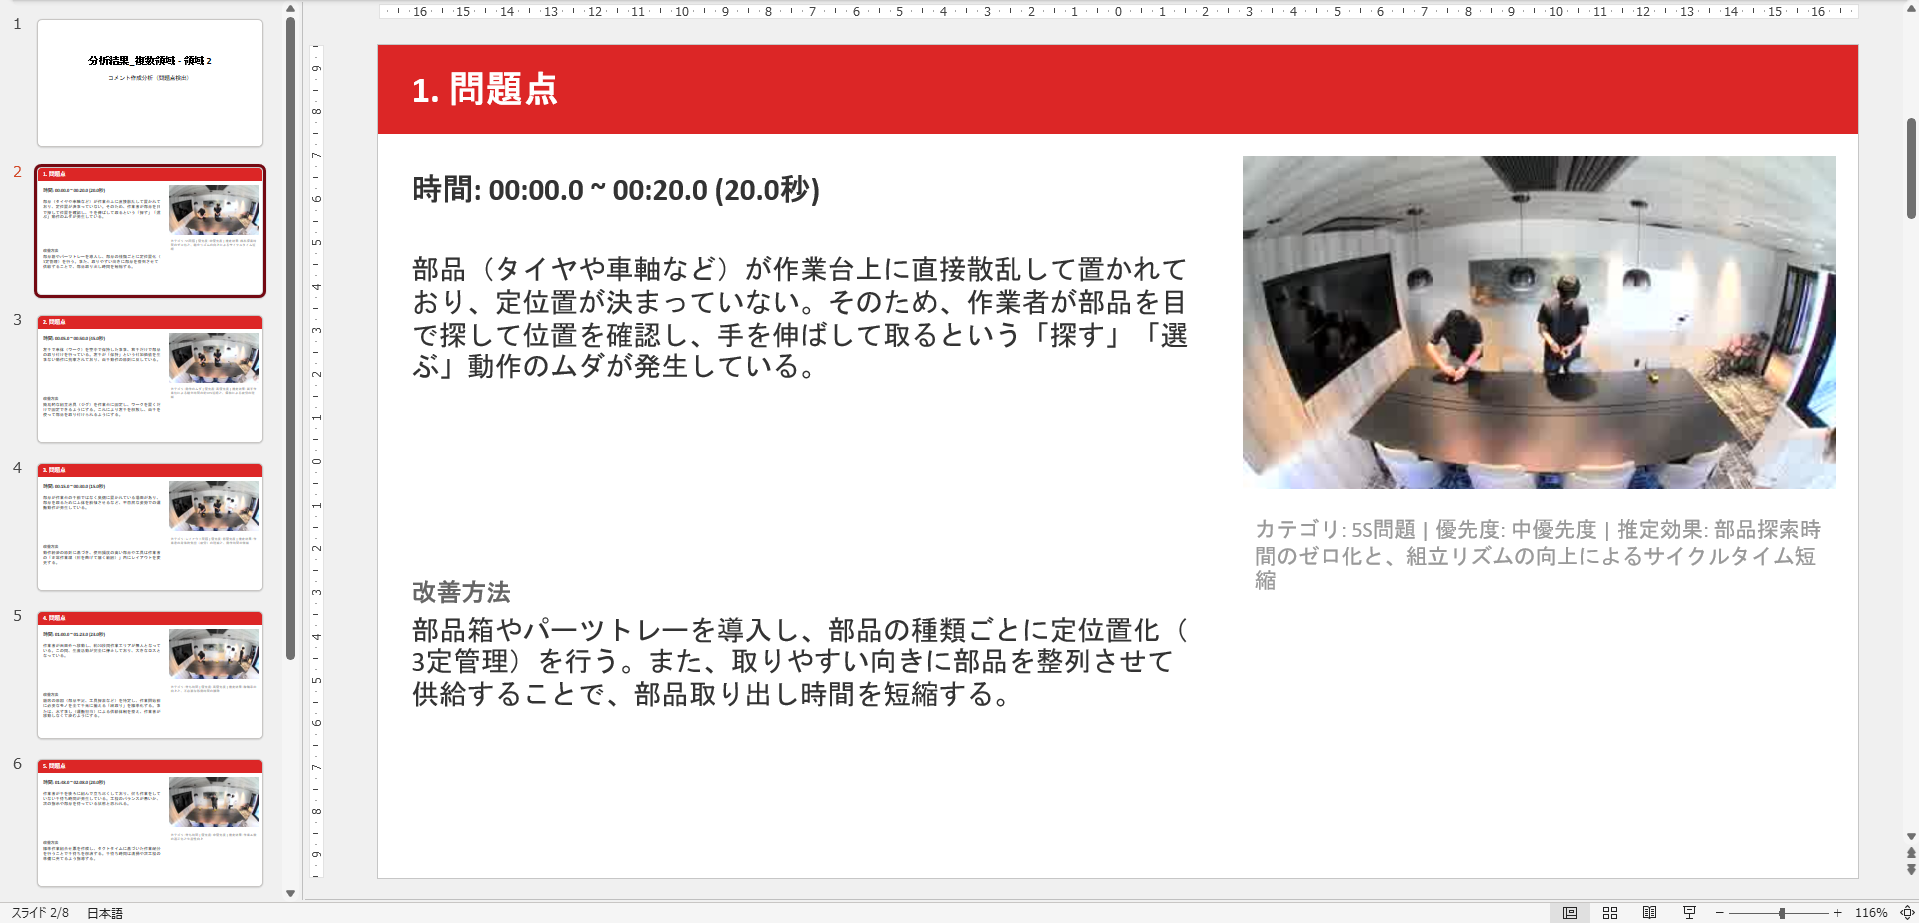
PowerPoint (PPTX) Format
Outputs a PPTX file for each specified area.
Analysis Video
Download the analysis video in its originally uploaded format.
Timeline
👉 You can review the classified tasks along a horizontal time axis. If multiple areas are specified, you can view the timeline for each area separately.
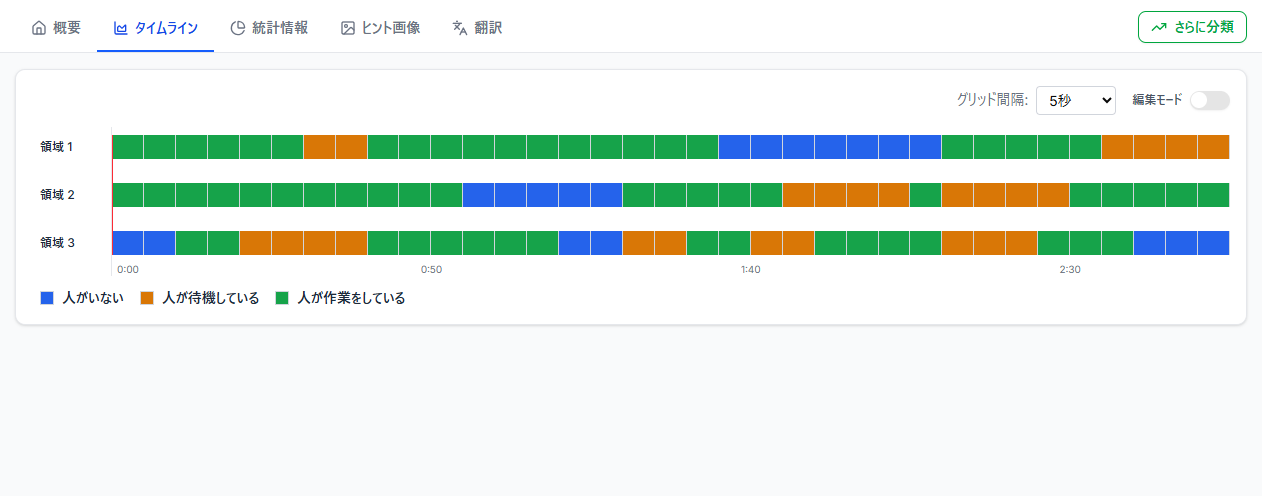
- Clicking on a grid segment allows you to play the video from the beginning of that specific segment.
Grid Interval
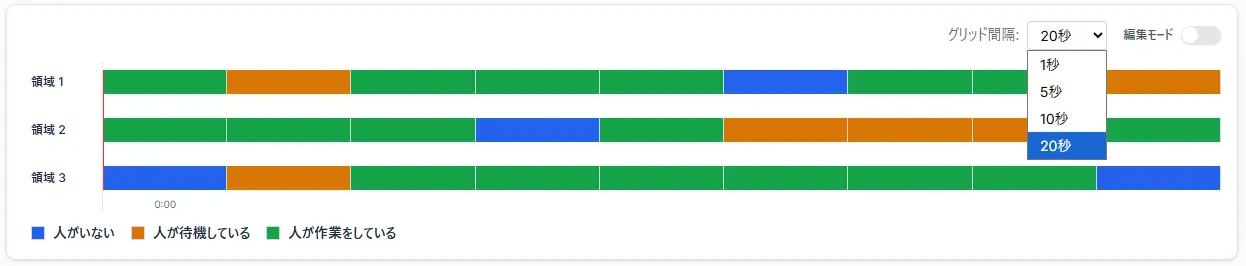
You can select from "1s, 5s, 10s, or 20s."
Once selected, the timeline will be generated with each segment representing the specified number of seconds. This allows for visualization at your preferred level of granularity.
Edit Mode
This is the same function as described in the following section.Manually Modifying Classification Results
Statistical Information
👉 You can review the classified information based on the total duration (in seconds) and its percentage relative to the entire video.
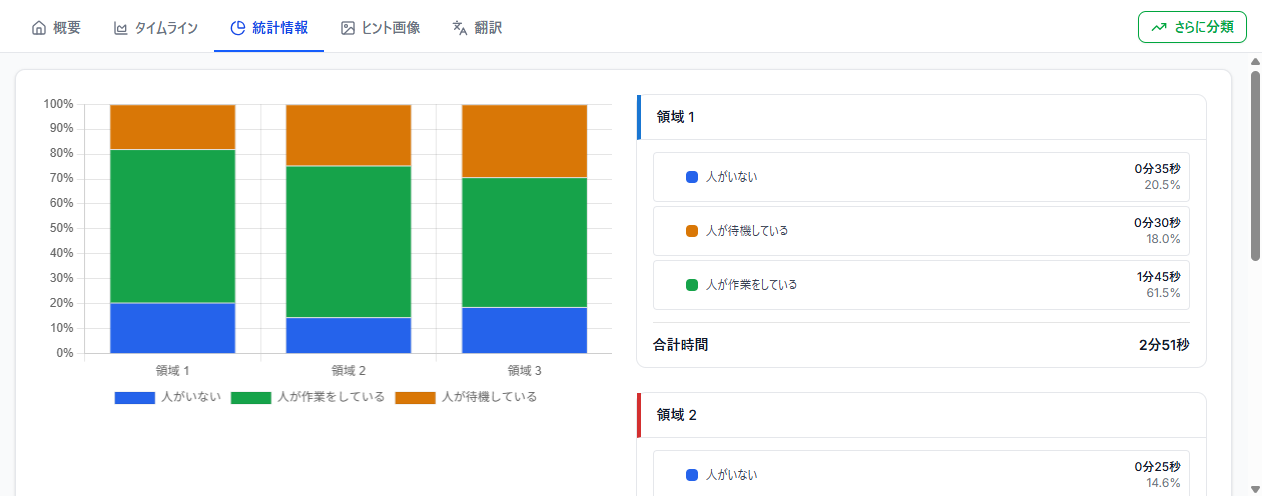
- The data is visualized as stacked bar charts for each area.
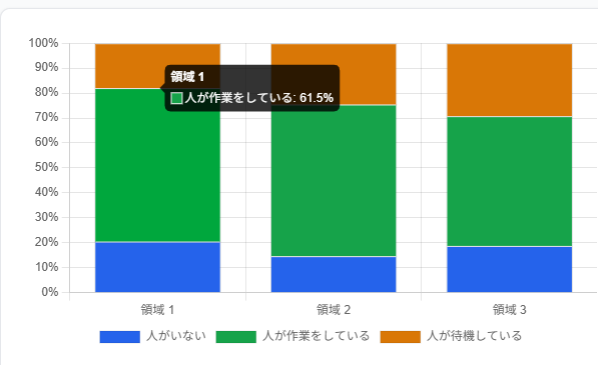
- By hovering over the elements of the stacked bar chart, you can check exactly what was classified and its specific proportion.
Hint Images
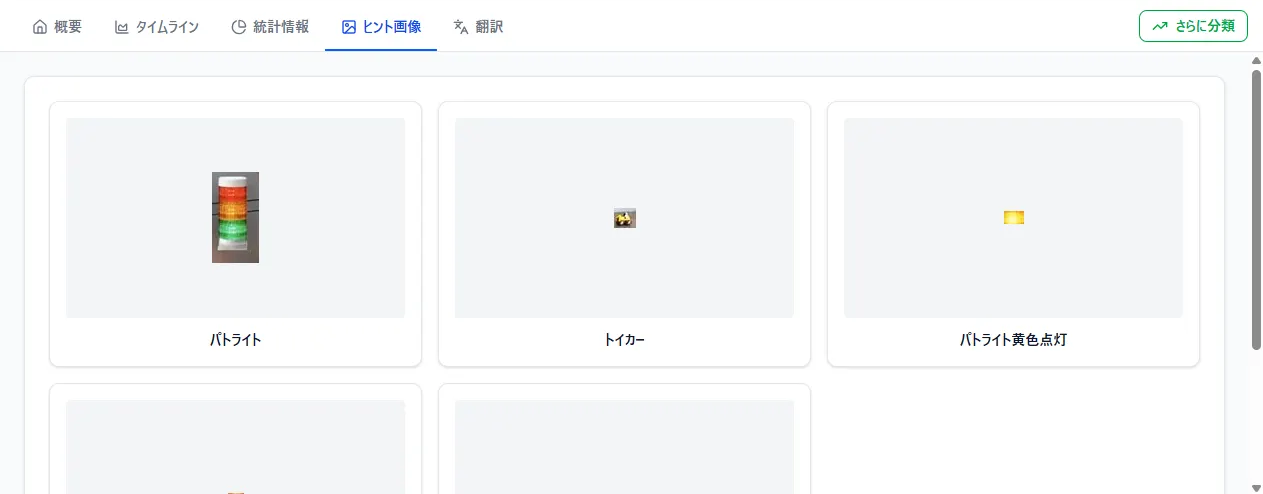
👉 Review the hint images registered before the analysis.
Translation
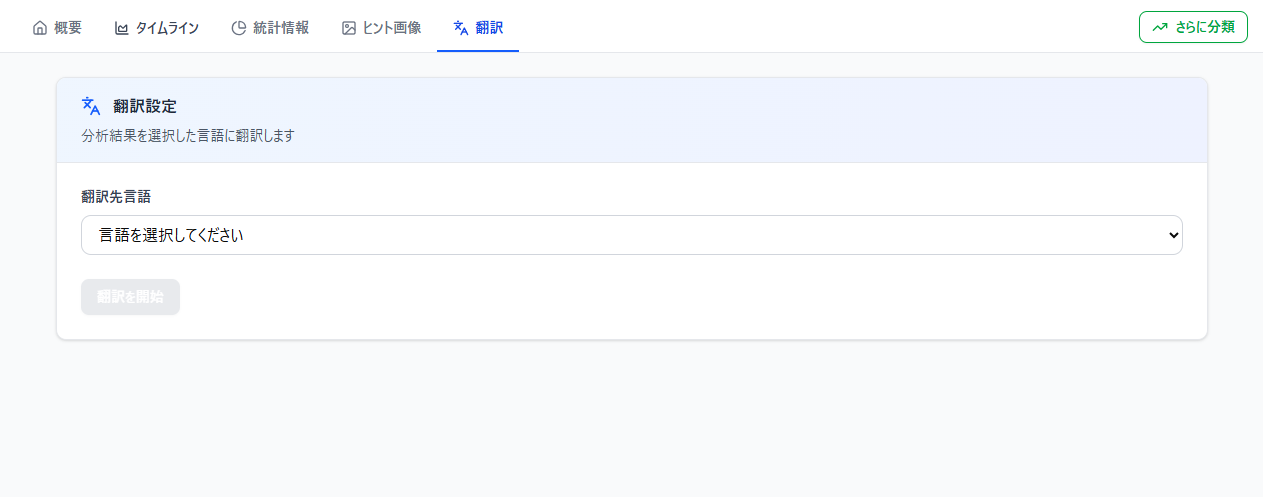
👉 Translate the results into your preferred language.
- Supported Languages:
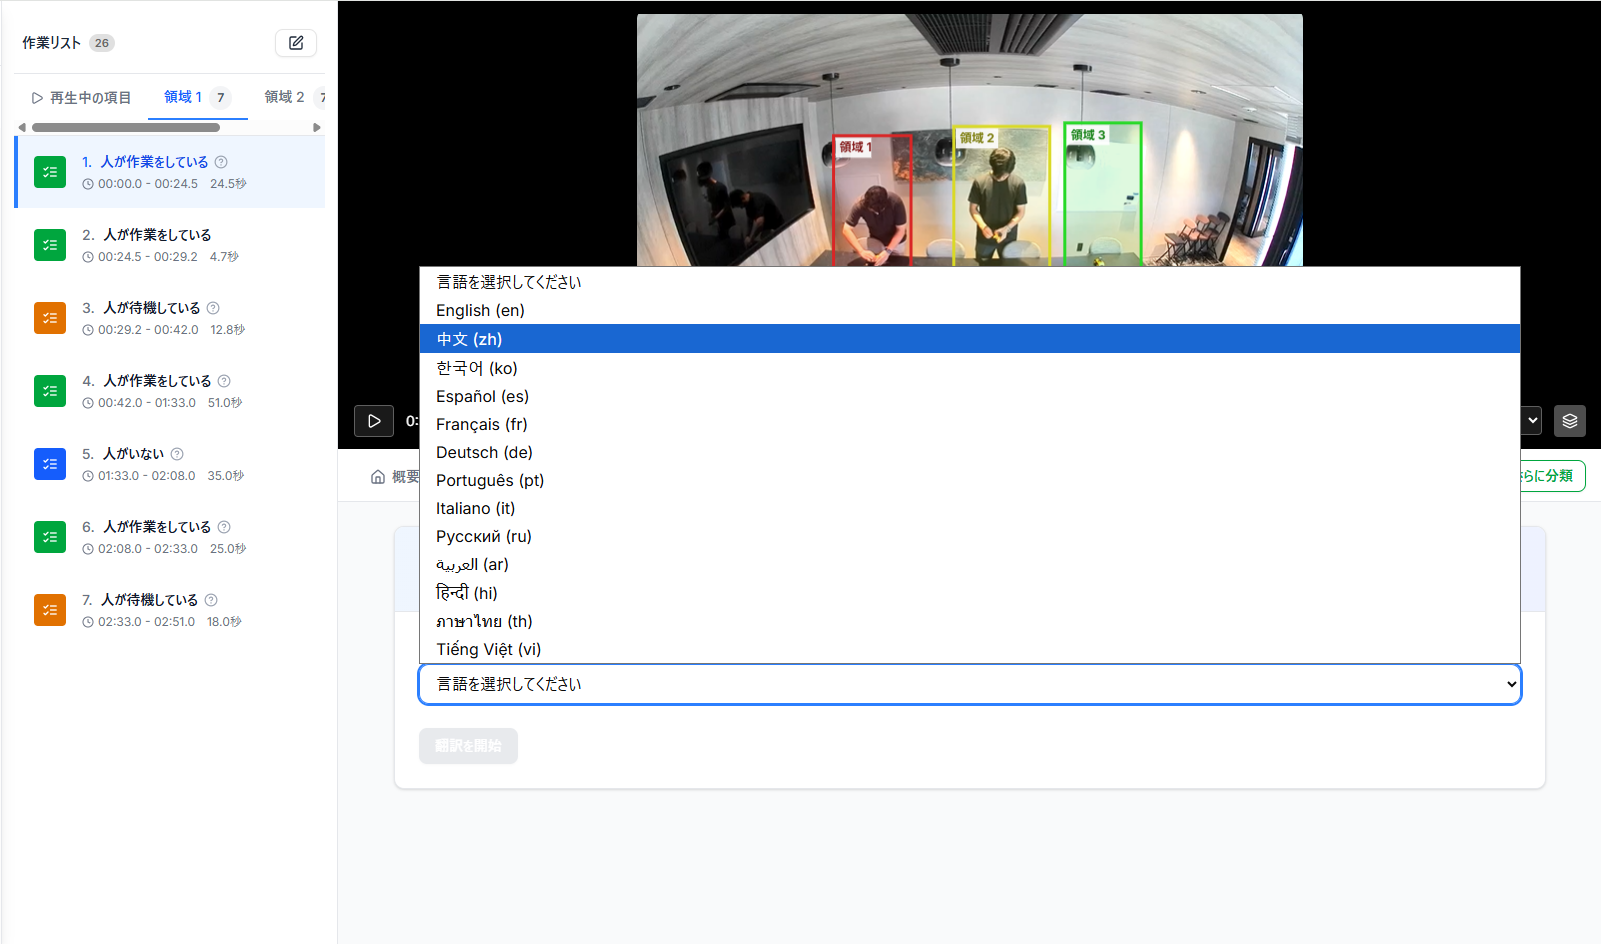
English, Chinese, Korean, Spanish, French, German, Portuguese, Italian, Russian, Arabic, Hindi, Thai, Vietnamese and more to come.
How to Translate
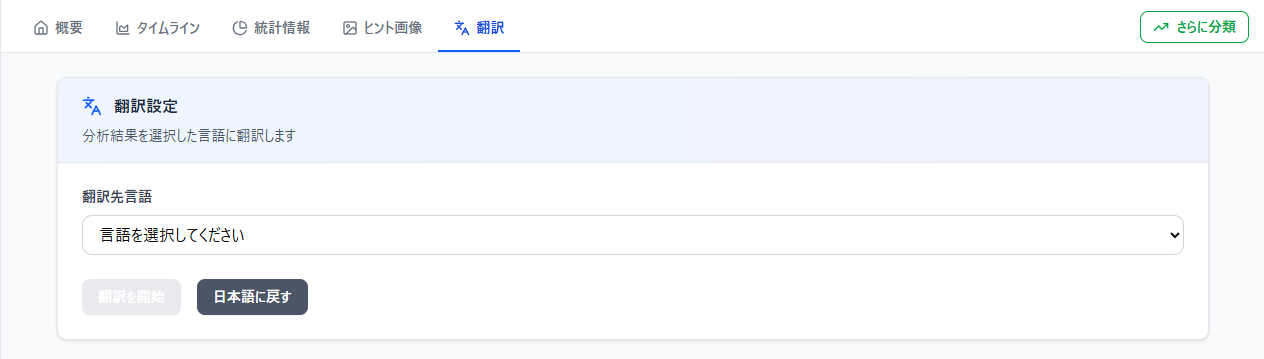
Step 1. Click "Please select a language" and choose from the list.
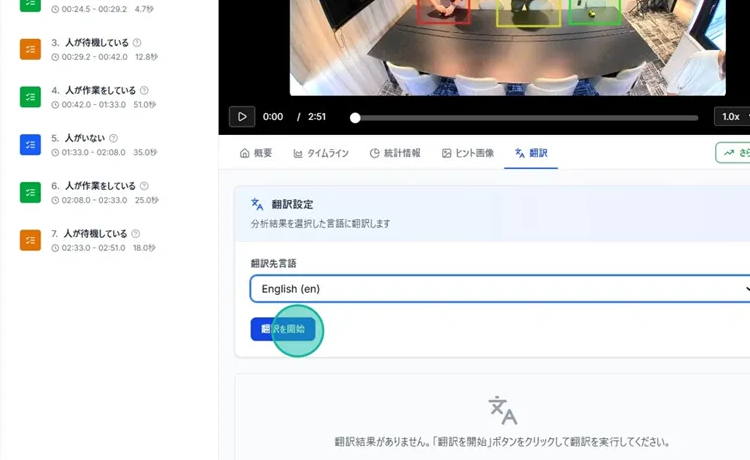
Step 2. Click "Start Translation" and wait for processing.
Step 3. The translated results will be displayed.
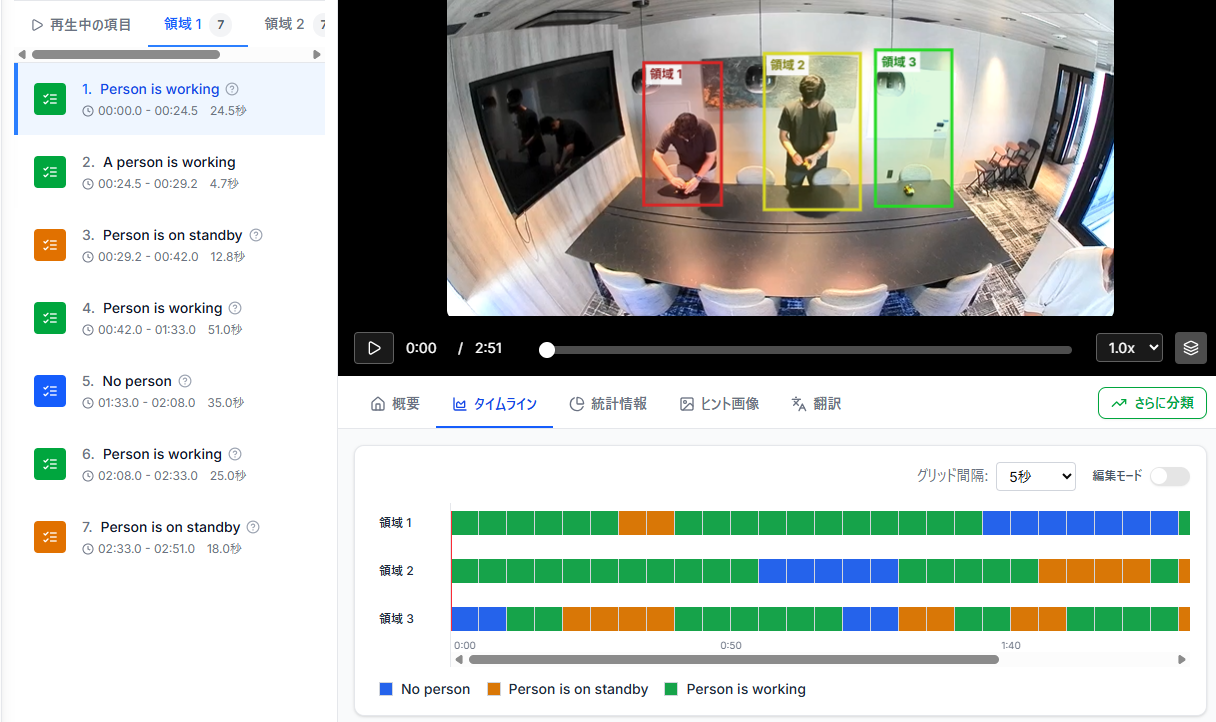
- A "Back to Japanese" button will appear, allowing you to switch back instantly.
- Translation time is reduced from the second time you execute it.